Sigma Layers
What Are Sigma Layers?
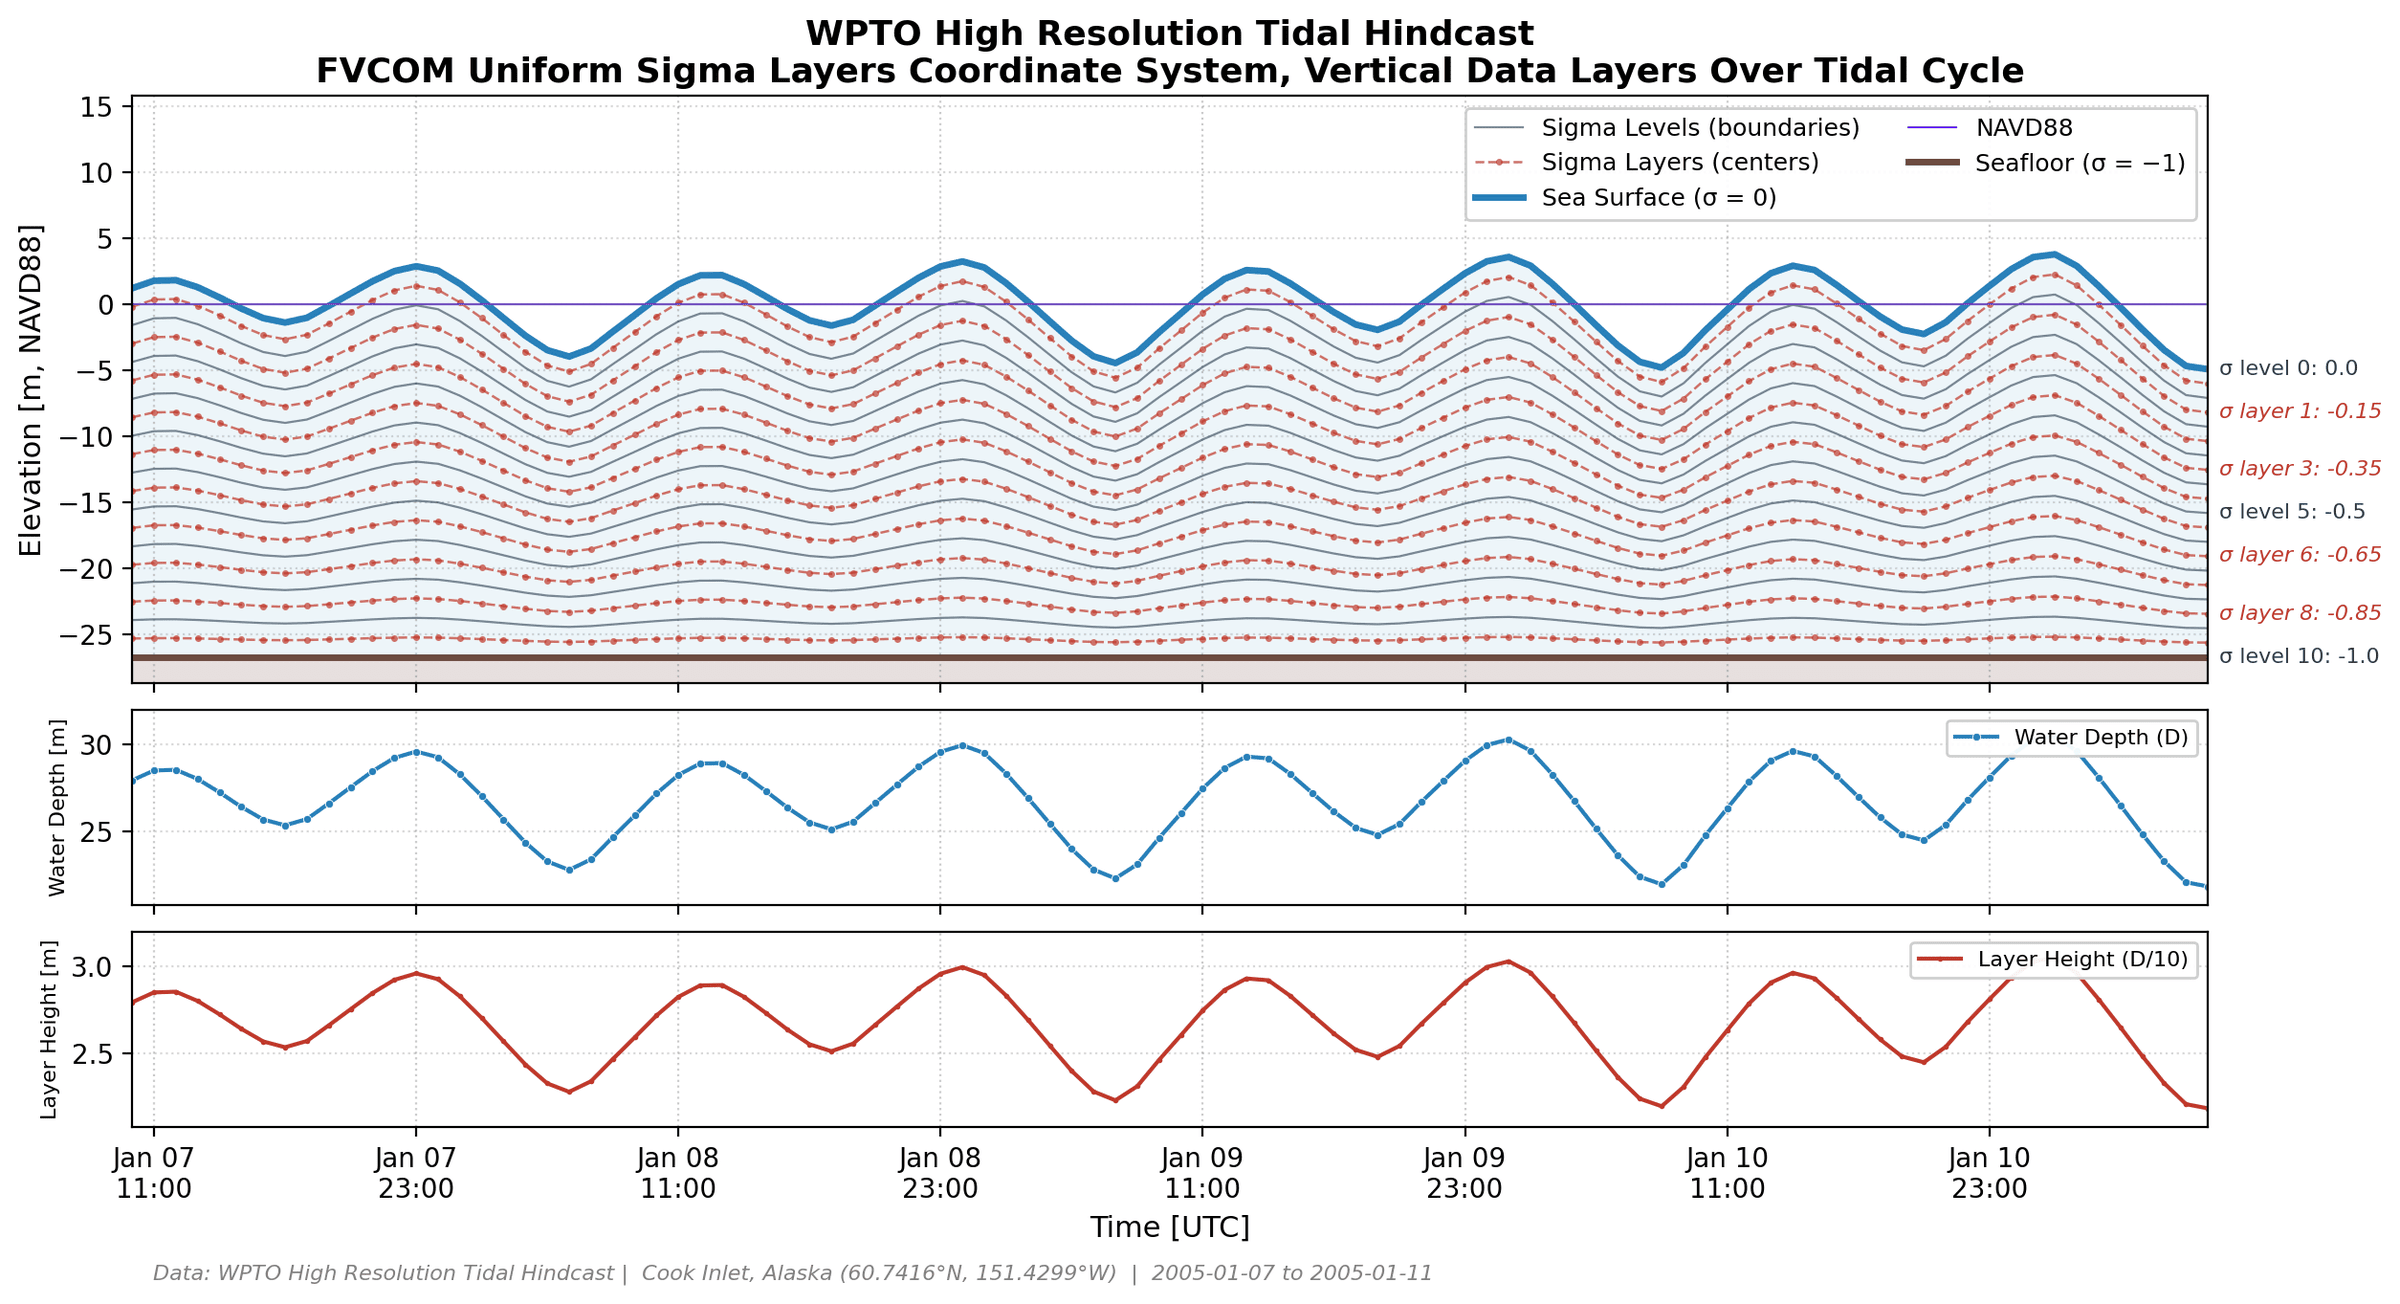
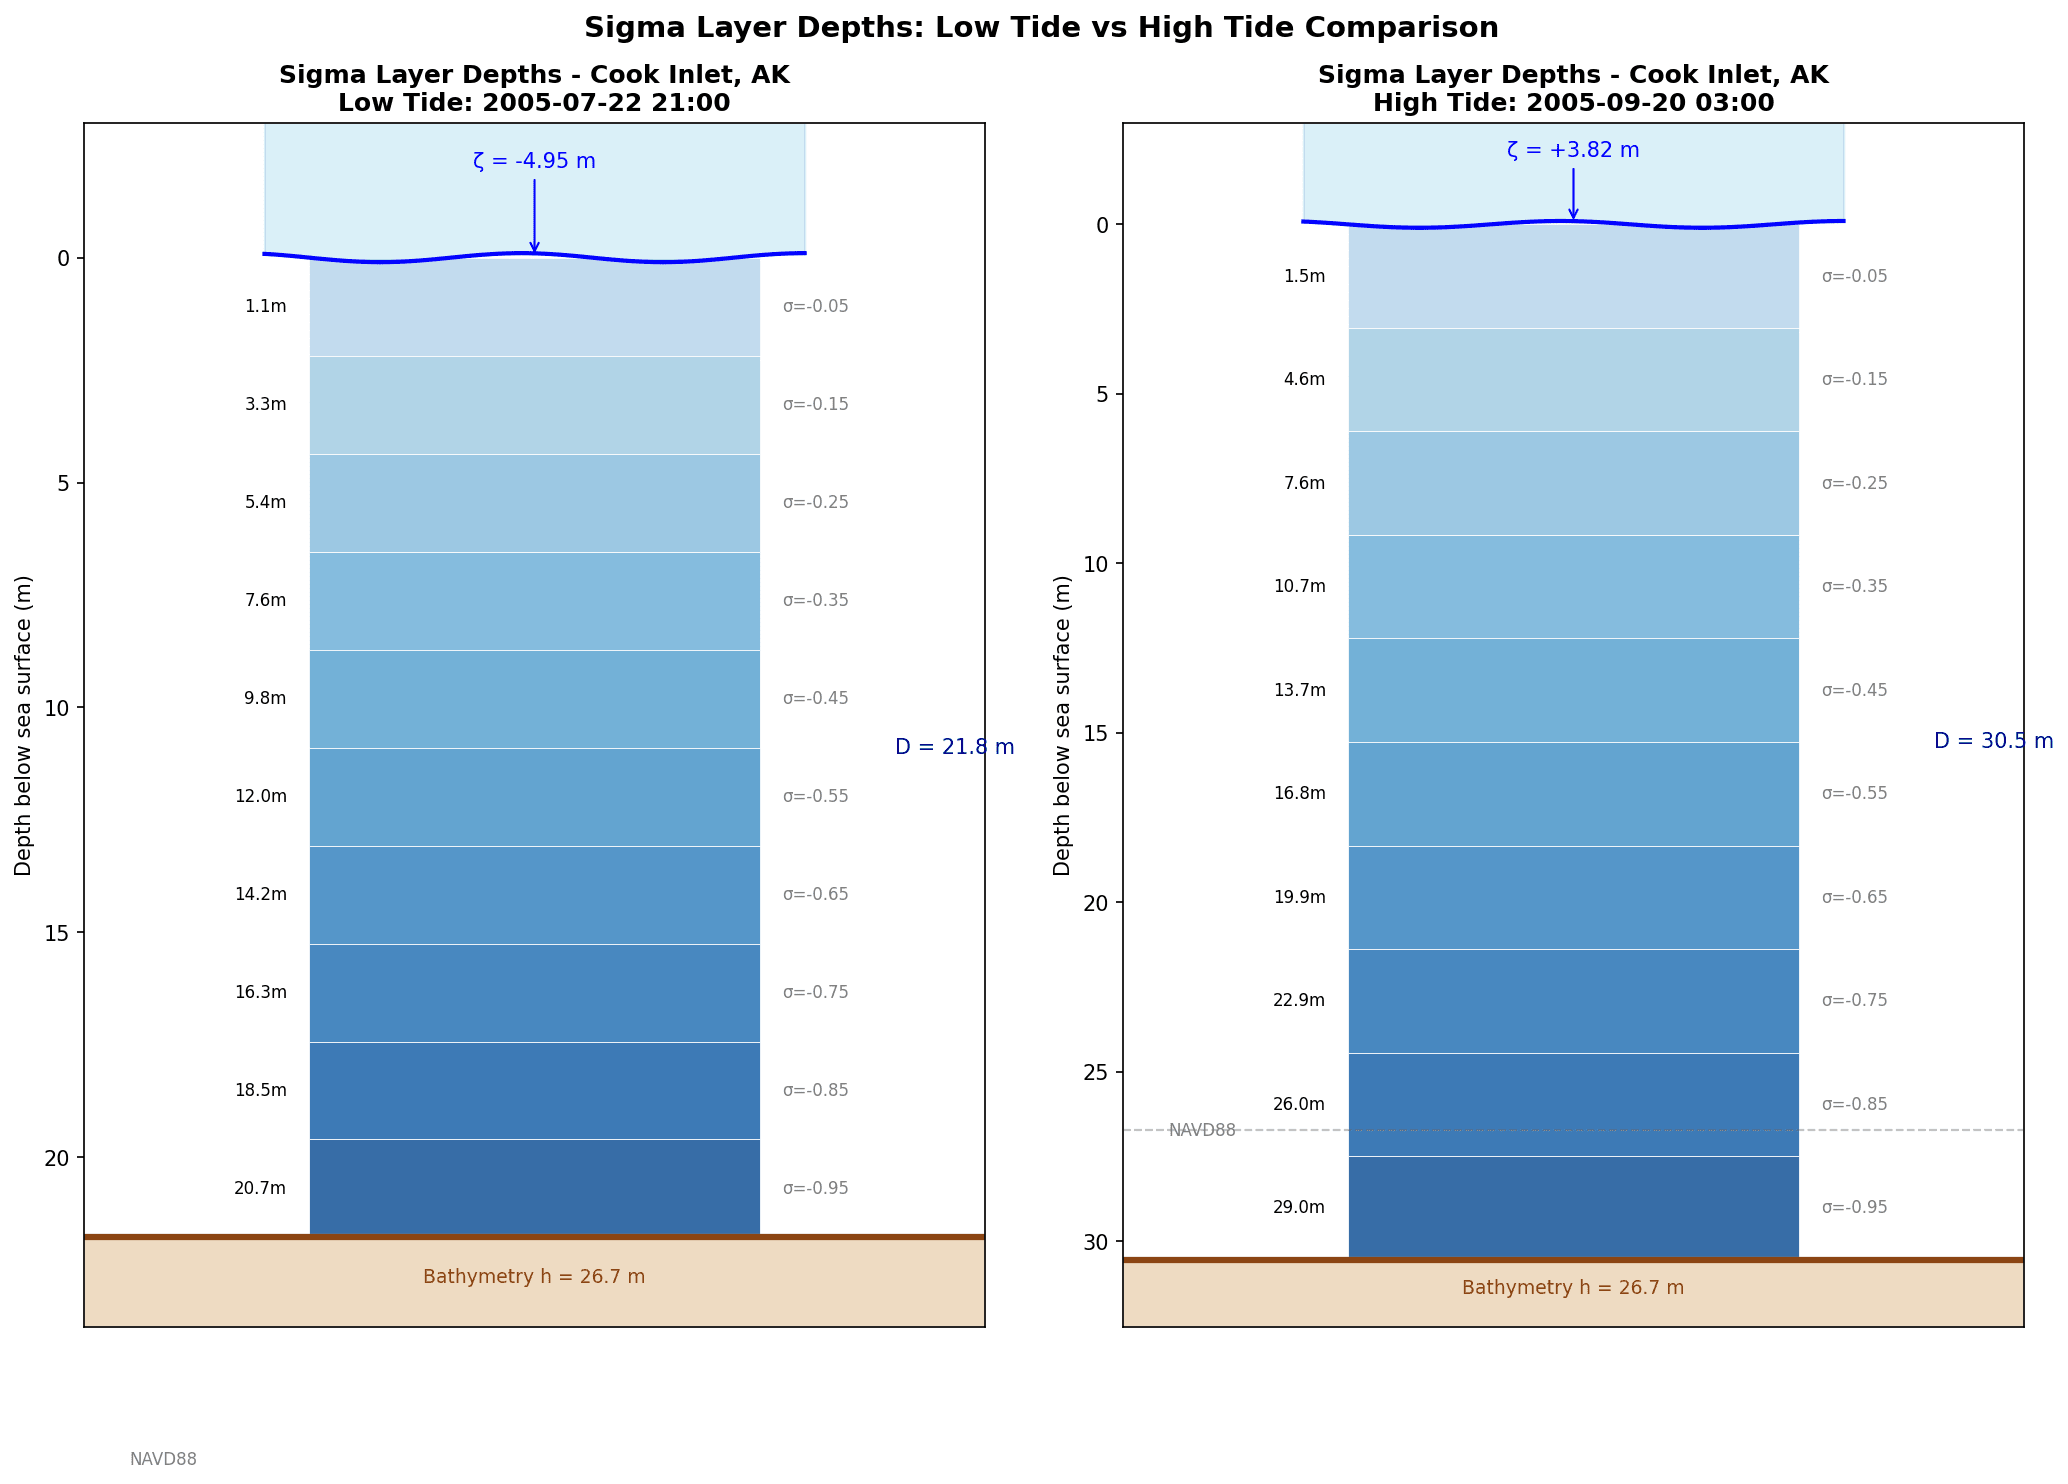
A sigma layer is a terrain-following vertical coordinate system where the water column is divided into layers with time-varying height to account for changes in the total water column height. Sigma (\(\sigma\)) expresses vertical position as a proportion of total water depth, ranging from \(\sigma = 0\) at the surface to \(\sigma = -1\) at the seafloor. Layers stretch and compress dynamically as water depth varies with tides.
Vertical Structure
The FVCOM model uses 10 uniformly spaced sigma layers. Model variables (velocity, etc.) are computed at each layer center. The physical depth of any sigma value is:
where \(D = h + \zeta\) (bathymetry + sea surface elevation).
Implications for Data Users
While sigma coordinates provide consistent data structure across varying bathymetry and tidal conditions, they require interpolation to extract data at fixed absolute depths. Queries such as "average current speed at 8 m depth" require calculating which sigma layers correspond to that depth at each timestep.
Depth-Averaging
A depth-averaged value is computed by averaging a quantity across all vertical layers (sigma layers) at a given horizontal location and time. Depth-averaging produces a single representative value for the entire water column, useful for characterizing overall flow conditions while accounting for vertical velocity profiles.
All summary variables in this dataset (mean current speed, power density, etc.) use depth-averaged values unless otherwise noted.
Depth-Maximum
The depth-maximum is the maximum value of a quantity across all vertical layers at a given horizontal location and time. The depth-maximum captures the peak value occurring anywhere in the water column, which is relevant for structural loading calculations where components must withstand the highest forces at any depth.
The 95th percentile variables in this dataset use depth-maximum values to capture extreme conditions.